
Tweaking Docker for Mac performance for PHP and Symfony
It’s a widely known, and a slightly sad, fact that Docker on macOS is not really the most performant piece of code in the universe. That’s truly a shame, since I really believe Macs make really good development machines - and that is with several years of Linux-on-the-desktop experience under my belt.
After being inspired by this tweet, I’ve decided to measure exactly how shitty Docker for Mac performance is, and check if I can tweak it somehow. (The actual charts will be at the bottom of the post).
My first avenue of escape from the performance hell was using the Edge version. It turns out that the Edge version has a new VM drive file format, which performs much faster than the current one. While you do need to reset all of your data for it to be applied, it’s still a worthwhile investment, as you will be rewarded with a 40% performance boost.
Another thing that you can do is to use delegated mounts when possible. This makes it so that the engine considers the state of the container’s file system as authoritative, giving you eventual consistency instead of forcing the file systems to always be identical. However, this did not turn out to be a big boost for me.
What did, however, turn out to be a big boost was using Docker volumes for the cache directory. It turns out that not having the additional layer of the host file system and putting the cache directly under the VM speeds up things quite a lot, as cache reads (from the application perspective) are now practically instant. This is not something I’ve seen any of the “example” projects do, but it actually helps quite a bit. Of course, this means you lose access to a (fresh) cache on your host machine but… do you really need it?
Additionally, you can mount the vendor directory as a Docker volume too. This provides another speed boost, to the point where running Composer is as fast as running it on the host machine. However this has the disadvantage of you not being able to browse the vendor directory in your IDE, which messes up various useful PHPStorm functionalities. You can decide whether this is worth it for you.
As an example of using volumes, I’ve provided a simple example app that you can use for benchmarking: https://gitlab.com/crescentrose/php-docker-benchmark
Benchmarks
And as promised, here are the graphs. The Y axis has the time taken in seconds (measured by the time tool) and the X axis is the number of the measurement - every scenario was measured 10 times.
cURL
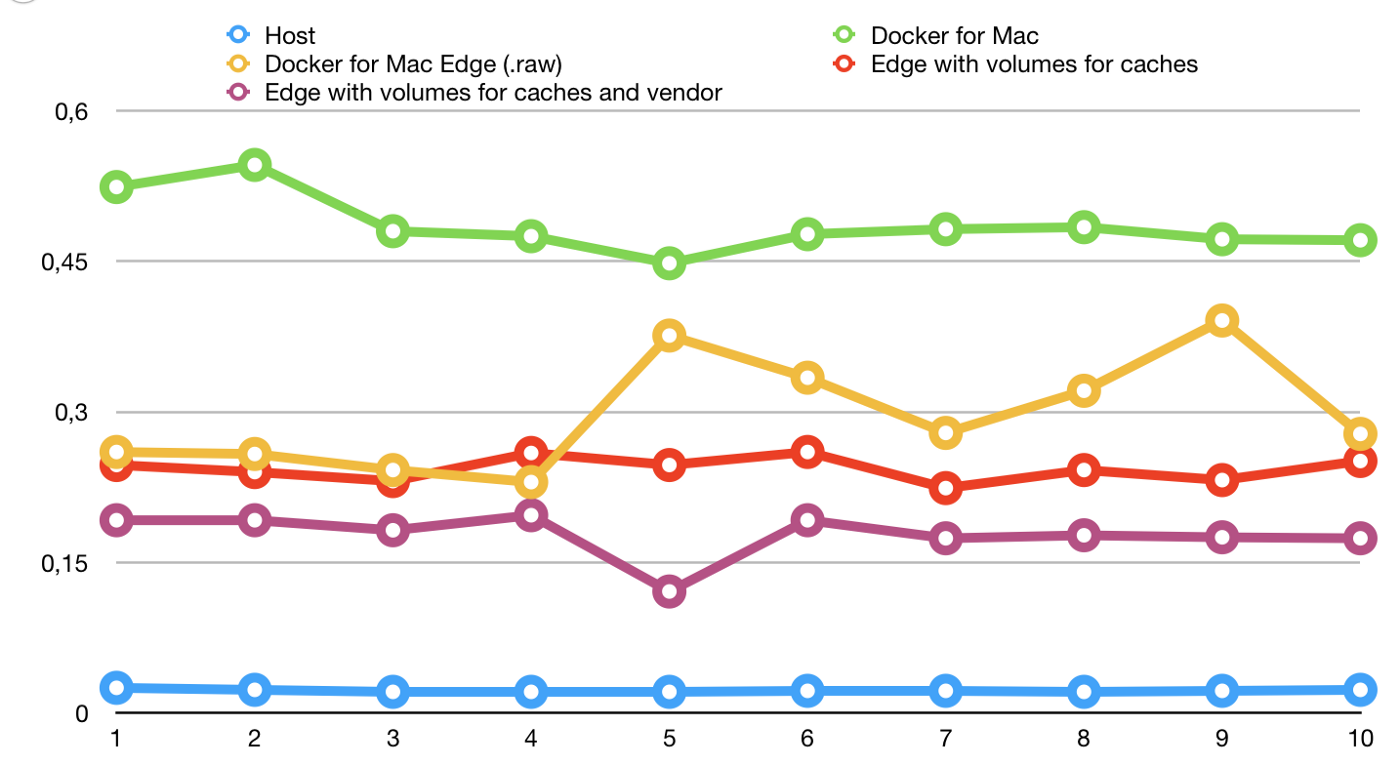
Opening a page on your host is still way faster than any of the Docker ways, but using volumes is clearly the best option as it draws very close to native performance.
Composer
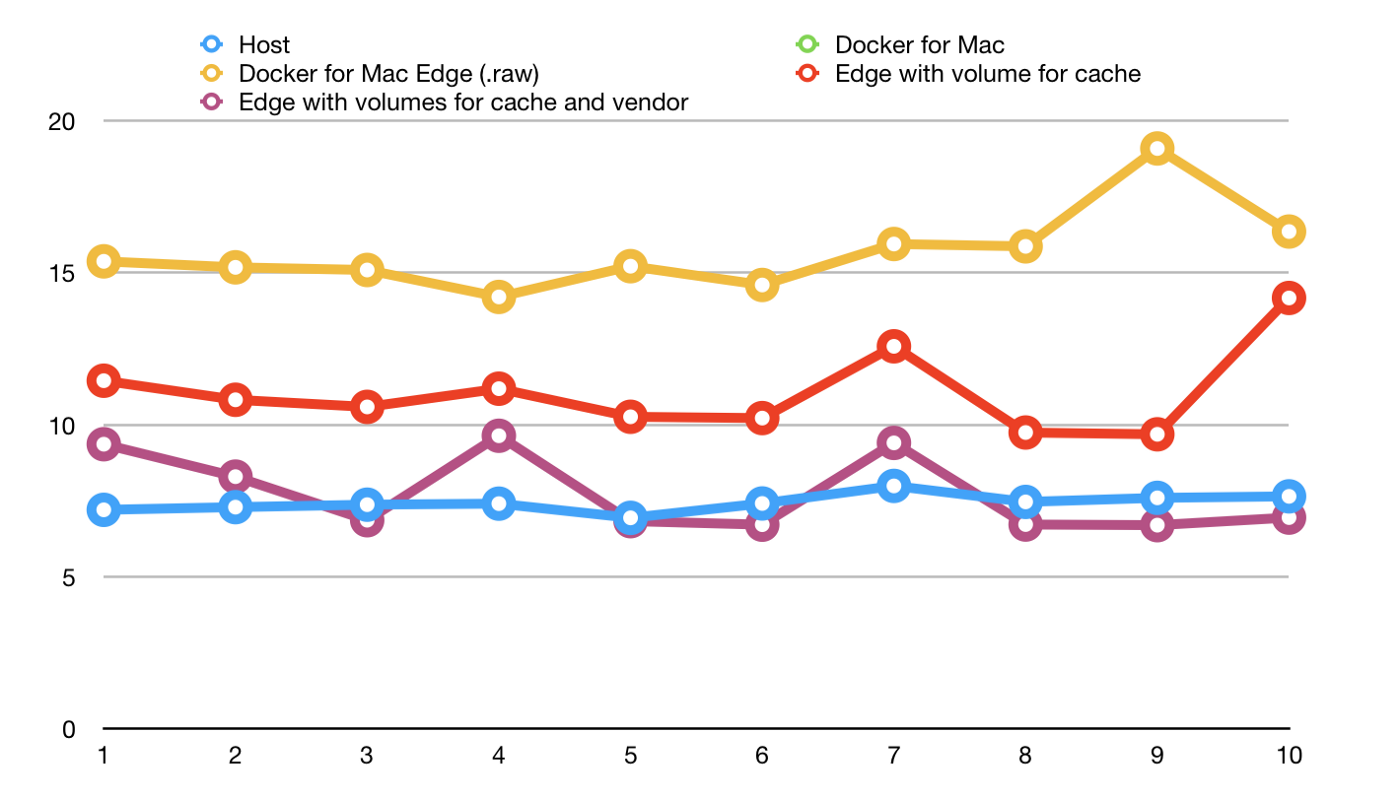
In this example, Composer is only performing autoload file generation and clearing the Symfony cache. (And I’ve sadly forgotten to measure the stable Docker for Mac values…). What’s impressive here is that, using volumes for both cache and vendor directories, the performance is mostly equal to the native performance.
PHPUnit
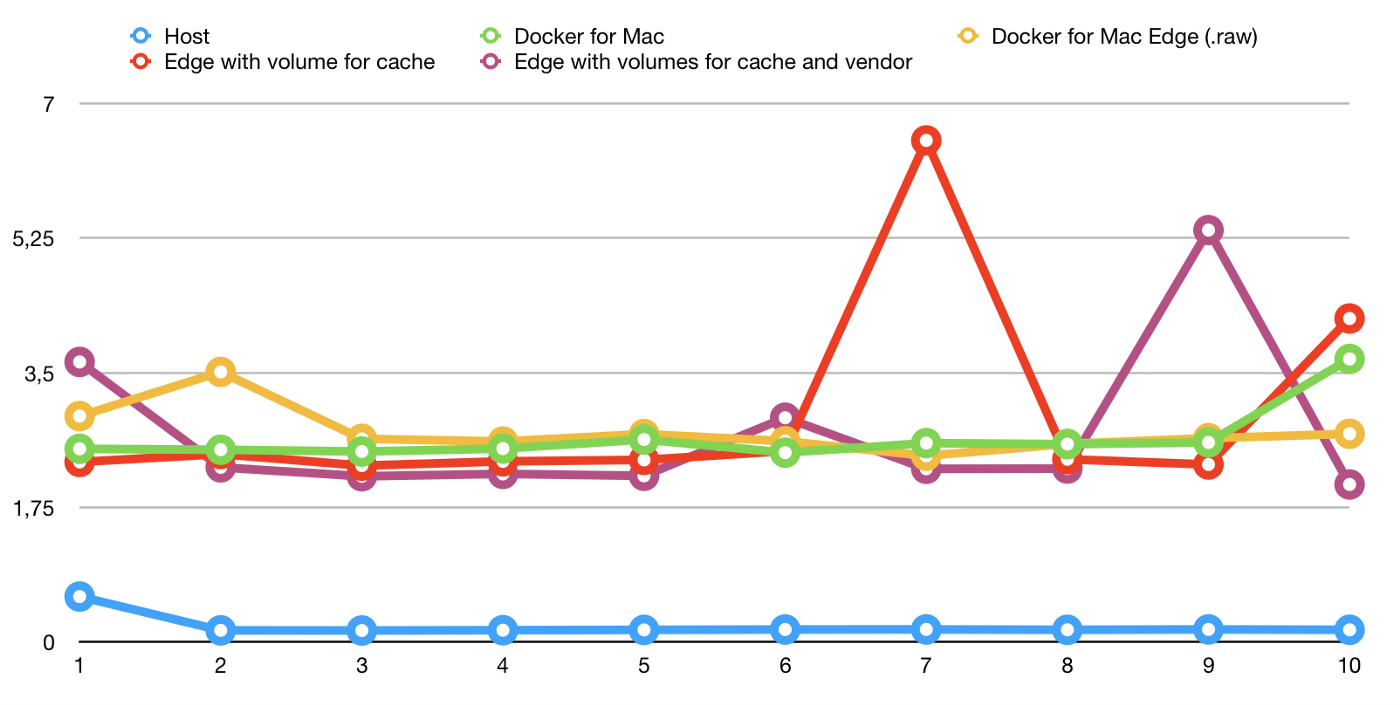
Since there is only one test available, you can clearly see the cost of creating a new container on macOS here. Surprisingly all Docker methods are similar with some weird spikes in the latter methods, but that could also be due to the nature of the test - if you had more complicated tests, I would guess the volumes for cache and vendor method would win out.
Medians for cURL and Composer
Surprise! I know how to do bar charts too! Here’s one showing the median time that it takes to fetch the front page and run composer install over the different methods.
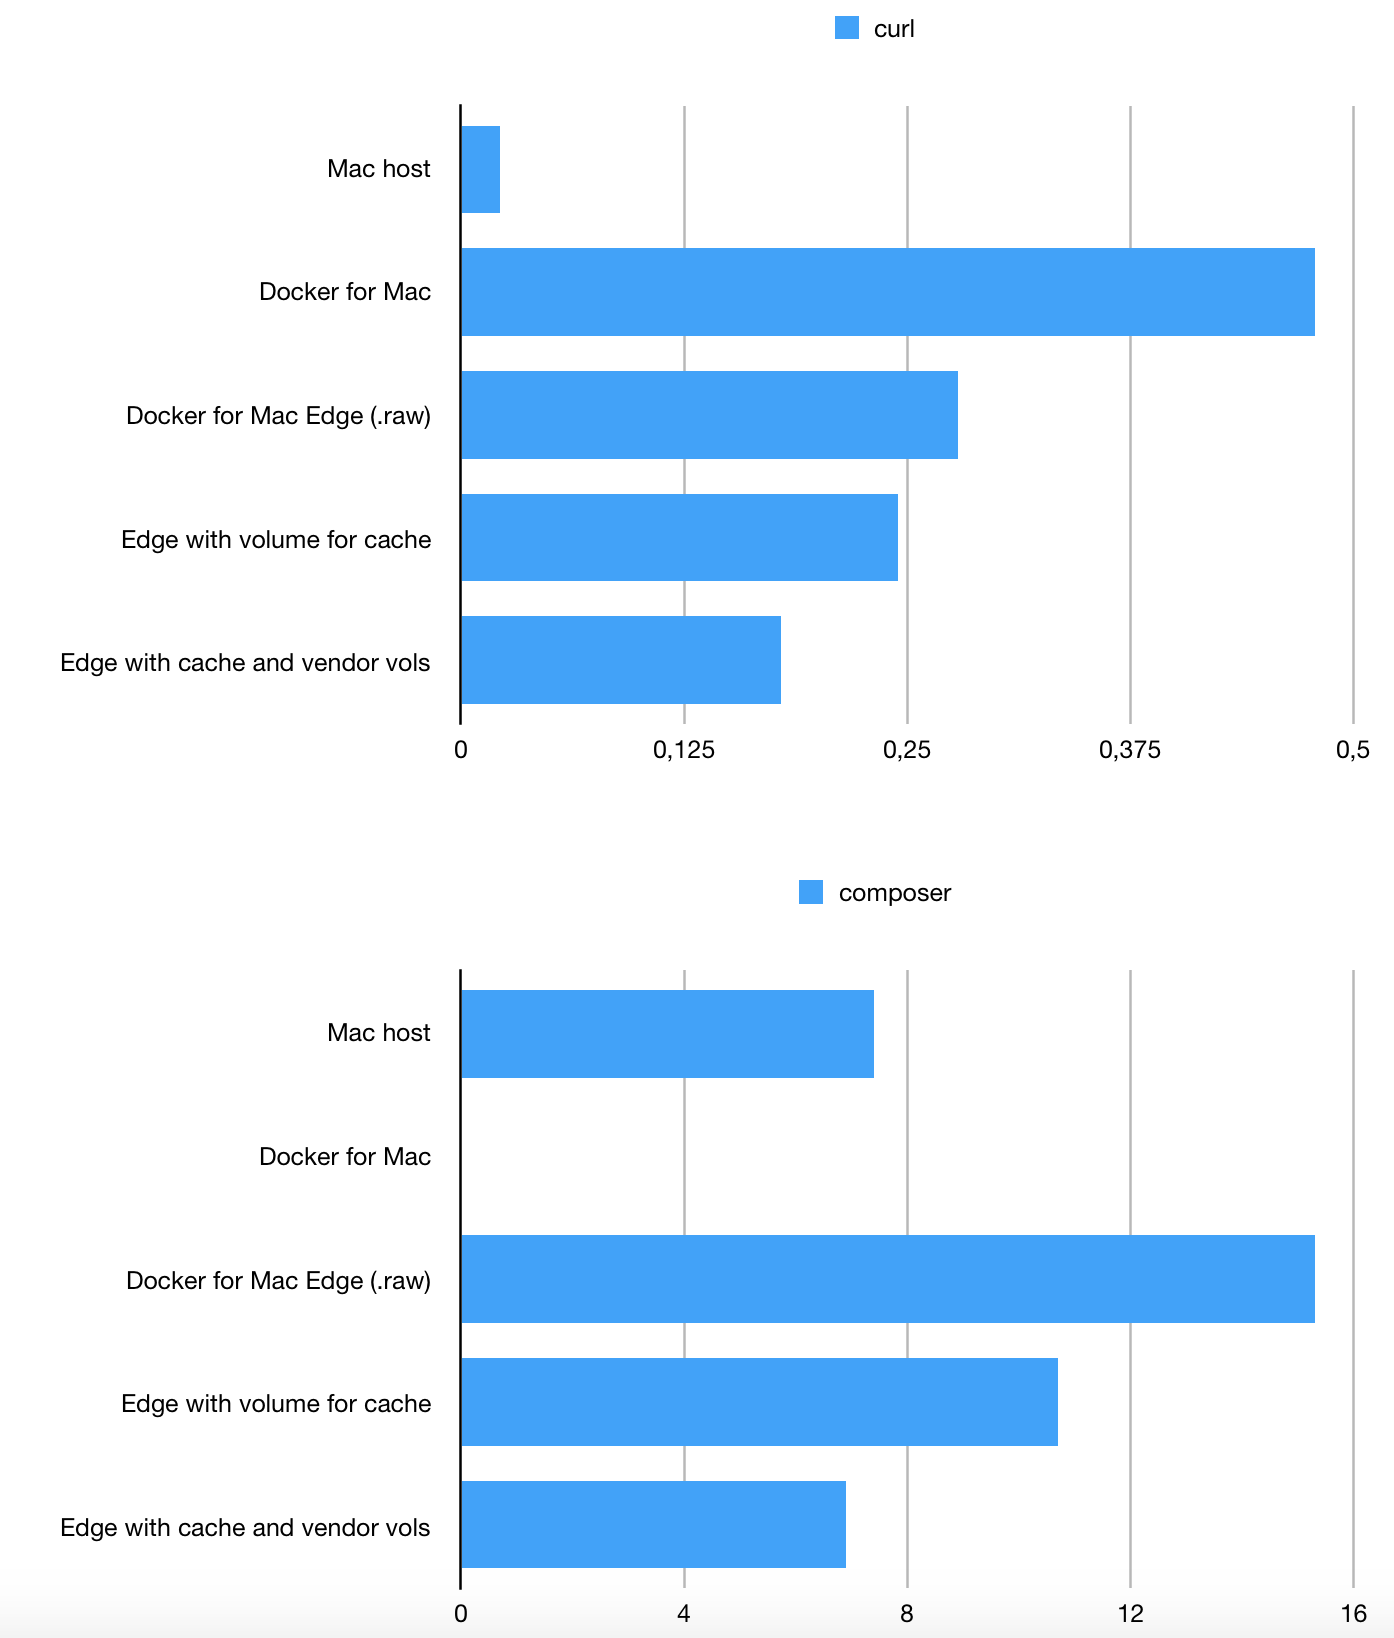
This is just a rehash of the previous charts, but I find it as a very effective tool of demonstrating the potential performance improvements.
Of course, Apple could also just improve their damn kernel, but I suppose this is some kind of petty revenge for no one giving a heck about macOS Server.
Thanks for taking the time to read, I’d appreciate any feedback, especially if I am doing something horribly wrong. Also, for occasional memes and NieR:Automata retweets you can follow me on Twitter as @somwhatparanoid.
Cover photo by Markus Spiske on Unsplash with some minor creative improvements by me.